

Introduction

Open the Queues tab under Monitoring in any environment that uses managed queues to see how each queue is processing jobs. The dashboard shows a card for every managed queue, followed by the environment’s failed jobs. The same queue cards also appear on the environment’s Metrics tab.
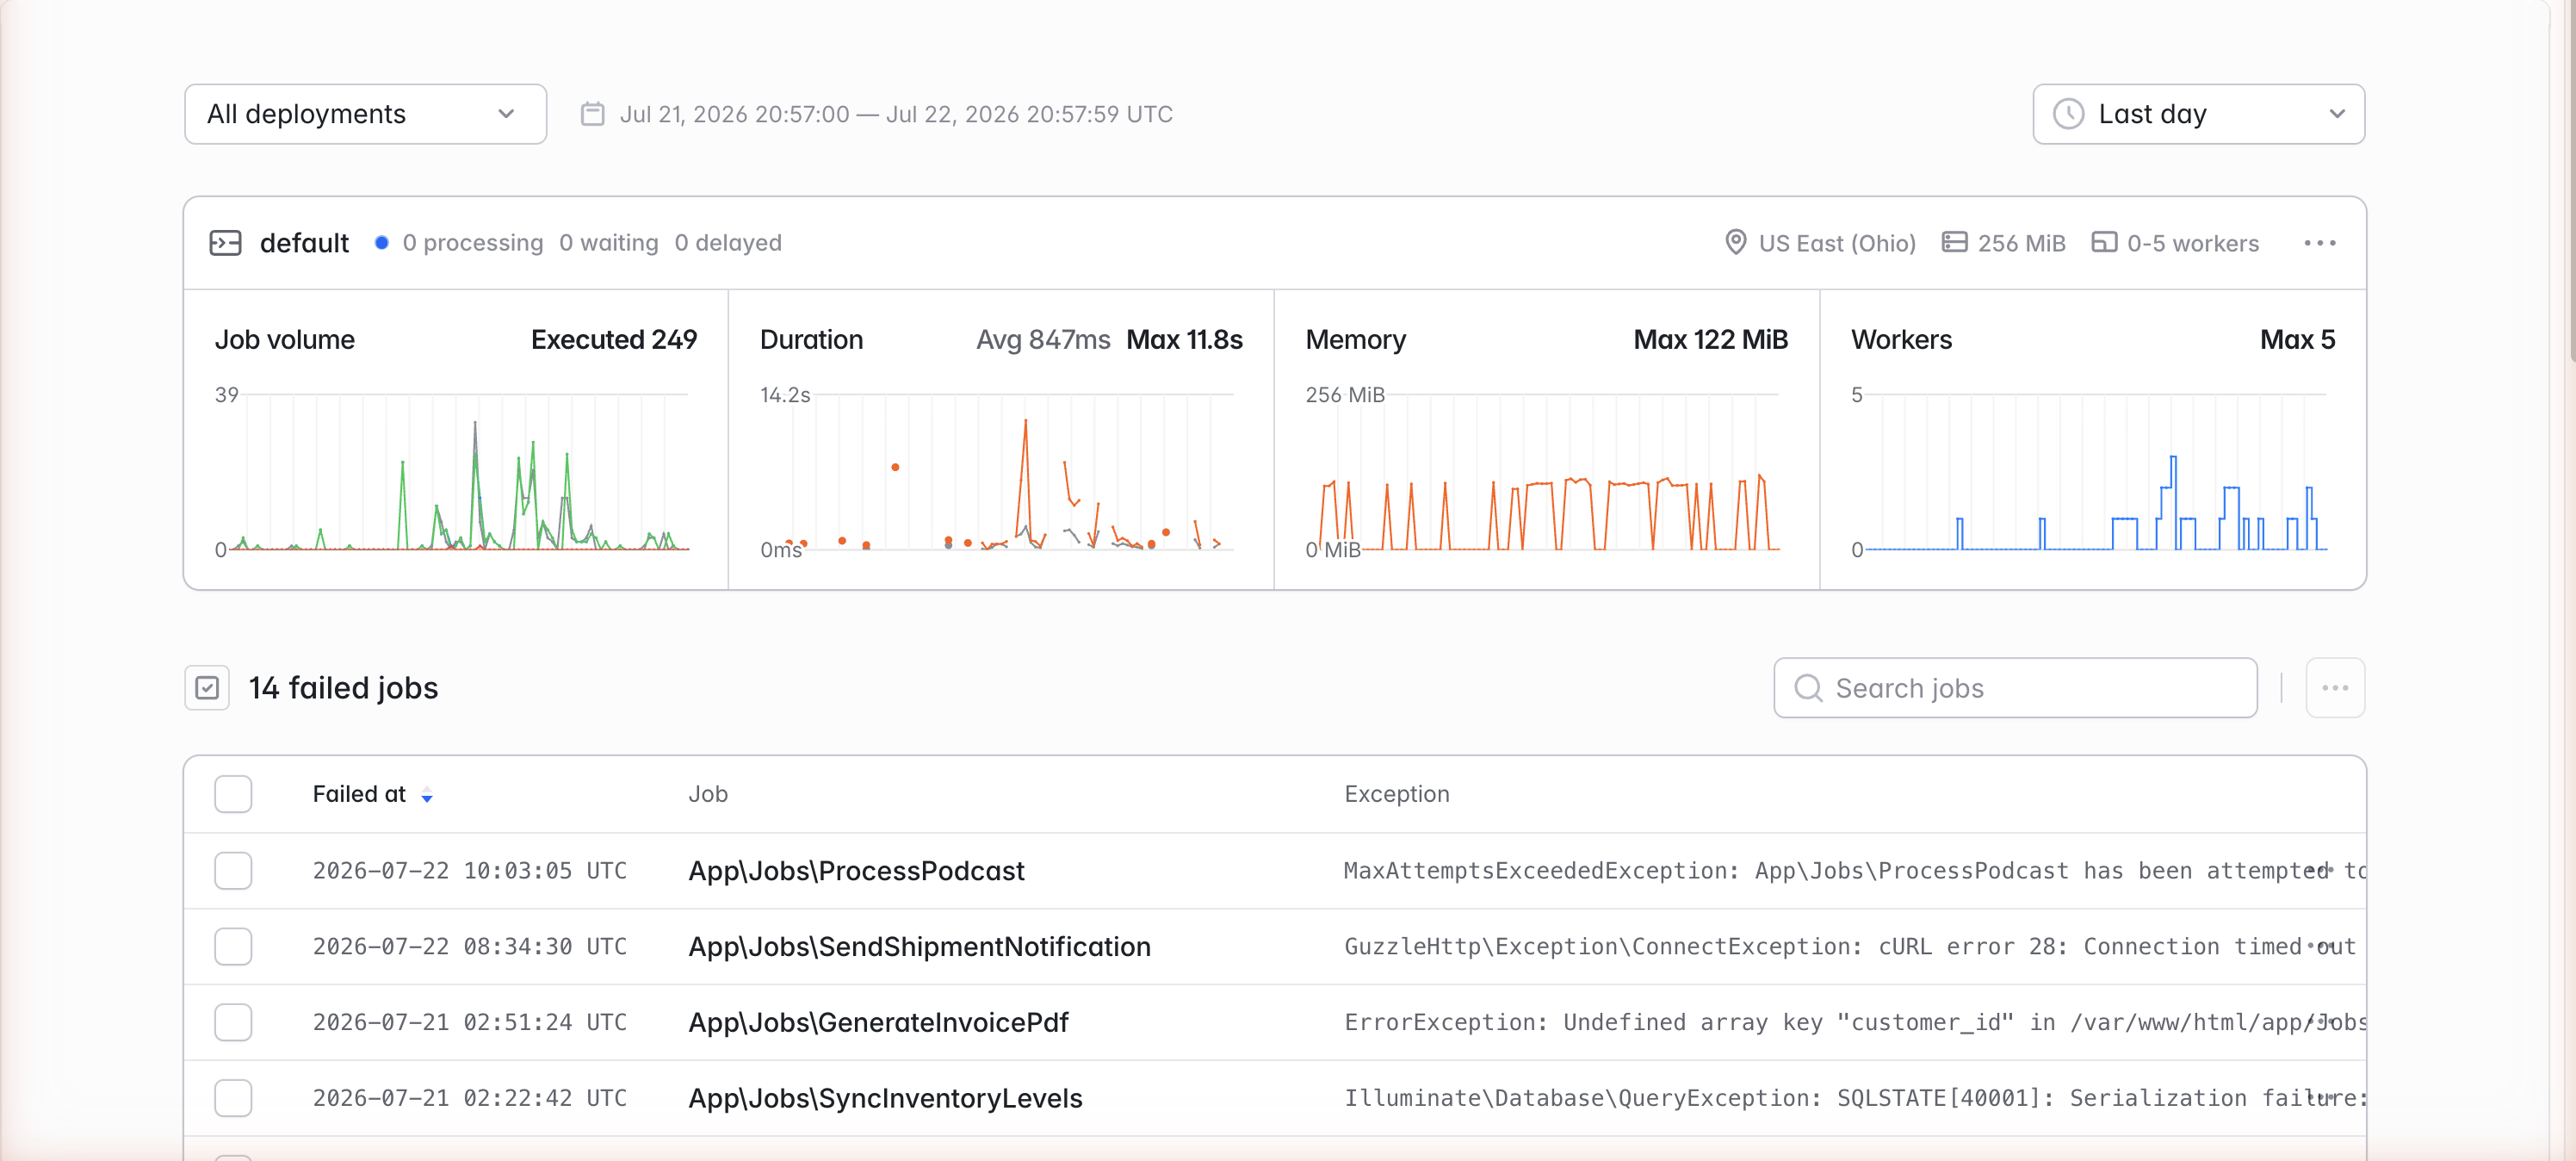
The Queues dashboard showing per-queue metrics and failed jobs
Each card shows the queue’s name, its worker memory size, and its configured worker range, such as 1–10 workers. The worker range is the autoscaling minimum and maximum you configured, not the number of workers running now. Use the time range selector to choose a period from Last 5 minutes to Last 30 days, or select a custom range, depending on your plan’s retention period. The dashboard refreshes every 10 seconds while it is open.

The lifecycle of a job

The queue metrics follow each job through the same steps:
  1. Your application queues the job by dispatching it.
  2. The job waits in the queue until a worker is free. If you dispatched it with a delay, it is delayed until the delay passes, then waits like any other job.
  3. A worker picks up the job and starts processing it.
  4. The attempt ends in one of three ways. The job is processed successfully, released back to the queue to be tried again, or permanently failed.
A released job returns to step 2 and starts again on its next attempt, so a single job can start several times before it is processed or fails.

Live status

Next to each queue’s name, Laravel Cloud shows how many jobs are in the queue right now: These are approximate counts at the current moment. They ignore the time range and deployment selectors. A Paused badge appears when you have paused the queue. A Waiting count that keeps growing means jobs are arriving faster than your workers can finish them. Laravel Cloud adds workers as the backlog grows, up to the queue’s maximum. If the backlog keeps growing while the queue runs at its maximum workers, raise the maximum or make the jobs faster.

Job volume

The Job volume chart counts what happened to jobs during each interval of the selected range. Each line is a number of events, not the number of jobs in the queue at that moment:
Queued is not the number of jobs sitting in the queue. It counts dispatches during each interval. To see how many jobs are waiting right now, use the Waiting count in the queue’s live status.
The headline Executed value is the total number of attempts that finished during the selected range, which is Processed, Released, and Failed added together. Comparing the lines tells you how healthy the queue is. When Queued and Processed stay close together, the queue keeps up with the work. A high Released count means jobs are retrying often, which usually points to exceptions, timeouts, or rate limits in the services your jobs call. Any Failed count means jobs failed permanently, either by exhausting their retries or failing explicitly, and need your attention. Each point covers a fixed interval that depends on the time range. For example, each point covers 1 minute in Last hour, 15 minutes in Last day, and 1 hour in Last 7 days. Hover over a point to see the time it covers.

Duration

The Duration chart shows how long workers spent running each attempt, from the moment a worker picked up the job until the attempt finished, was released, or failed. It does not include the time the job spent waiting in the queue.
  • Avg: the average attempt duration during each interval.
  • Peak: the longest single attempt during each interval.
The headline Peak value is the longest attempt during the selected range. Compare it to your job timeouts. On Flex queues, workers that must stop have 90 seconds to finish their current job, so jobs that regularly approach that duration belong on Pro.

Memory

The Memory chart shows the highest memory usage of any worker on the queue, as a percentage of the worker’s memory size. Hover over the chart to see the memory in use, such as 45.0% (115/256 MiB). The headline Peak value is the highest percentage during the selected range. The chart can briefly exceed 100% when a job uses more memory than its worker allows. The worker then restarts and Laravel Cloud retries the job. If the chart regularly approaches 100%, choose a larger memory size. See the queue worker memory sizing guide for help choosing one.

Workers

The Workers chart shows how many workers were running over time, including the workers that autoscaling added and removed. Hover over the chart to see the count, which the tooltip labels Replicas. The headline Peak value is the highest number of workers that ran during the selected range, and the chart’s vertical axis extends to the queue’s maximum workers. If the chart regularly reaches the queue’s maximum while the Waiting count grows, the queue needs more workers. Choose a maximum that your database, APIs, and other downstream systems can handle in parallel.

Filtering by deployment

Use the deployment selector to show data for a single deployment. The selector filters the Job volume and Duration charts and the failed jobs list. Use it to compare how jobs behaved before and after a change. The Memory and Workers charts and the live status always show every deployment.

Failed jobs

The failed jobs list shows every job that failed permanently in the last 91 days and has not been retried or deleted. It does not follow the time range selector, so its count usually differs from the Failed line in the Job volume chart, which counts failures during the selected range, including jobs you later retried or deleted. Each row shows when the job failed, the job class, the queue, and the exception. Use the queue selector and the search field to narrow the list. Click a job to inspect its payload and stack trace, retry it, or delete it. Viewing job details requires permission to view failed jobs, and retrying or deleting them requires edit access to the environment.

Worker crash alerts

When a worker on a managed queue crashes and restarts, Laravel Cloud shows an alert on the queue’s canvas card and on its card in the dashboard, and sends a notification at most once a day for each queue. Jobs that were running on the worker return to the queue, and another worker retries them according to your retry settings. Click View latest occurrence to open the worker’s logs from the time of the crash. Jobs that run out of memory are a common cause of repeated crashes, so check the Memory chart first.