
I had a Laravel 12 app sitting on Laravel Cloud with autoscaling turned on and no real traffic hitting it, and that bothered me.
Not in a “this is a problem” way. More like: I’m a Solutions Engineer at Laravel. I talk to customers every day about what Cloud can handle. One of those customers had a setup I wanted to put through its paces. And I’d never actually pointed a serious load-testing tool at Cloud to see what would happen.
So I did.
I set up Grafana Cloud k6, built a custom endpoint designed to simulate realistic traffic patterns, and let it run for an hour. This is what a real Laravel load testing benchmark looks like, including how Laravel Cloud's autoscaling behaves under 20,000 concurrent virtual users.
The result: 17,000 requests per second, sustained. Autoscaling handled roughly a million requests per minute through the full middleware stack, with 15% of those requests deliberately holding connections open for 33 seconds each. The app didn't flinch.
Here's exactly what I tested, how I set it up, and what the numbers actually looked like.
Setting Up k6 for Laravel Cloud Load Testing
Before I get into results, the setup matters. If you’ve ever read a benchmarking post where someone hammers a health check endpoint and claims victory, you know why.
Here’s the script I used on k6 to load test Laravel Cloud:
I didn’t want to test a “hello world” route. I also didn’t want to overcomplicate it with database calls on the first pass. I wanted to isolate the platform first: can Laravel Cloud handle serious connection volume and autoscaling pressure on its own, before we start layering in other variables?
So I built this:
Bimodal response-time jitter is a load test in which response times cluster around two distinct speeds rather than one, creating a split pattern rather than a single curve. In this setup, 85% of requests get a fast response, with a random delay between 2 and 120 milliseconds. The other 15% get hit with a ~33-second delay to simulate slow spikes.
This matters because real traffic doesn’t hit your app in uniform waves: you get bursts, you get slow requests holding connections open while fast ones fly through. That 15% slow path at 33 seconds is going to stress connection pooling and autoscaling in ways a flat-latency test never would.
The endpoint sat at /loadtest on a standard Laravel 12 app, registered through web.php, which means full middleware stack: session handling, CSRF protection, cookie encryption, all of it. We’re using the real deal, not a stripped-down API route.
The app was running on Laravel Cloud with autoscaling enabled, running Nginx/FPM.
Load Test Results: 17,000 Requests per Second
I configured Cloud k6 to ramp up to 20,000 virtual users and hold there for an hour.
The platform sustained 17,000 requests per second at peak, settling into the 10,000-15,000 range for the sustained portion of the test. Here’s the Cloud k6 summary:
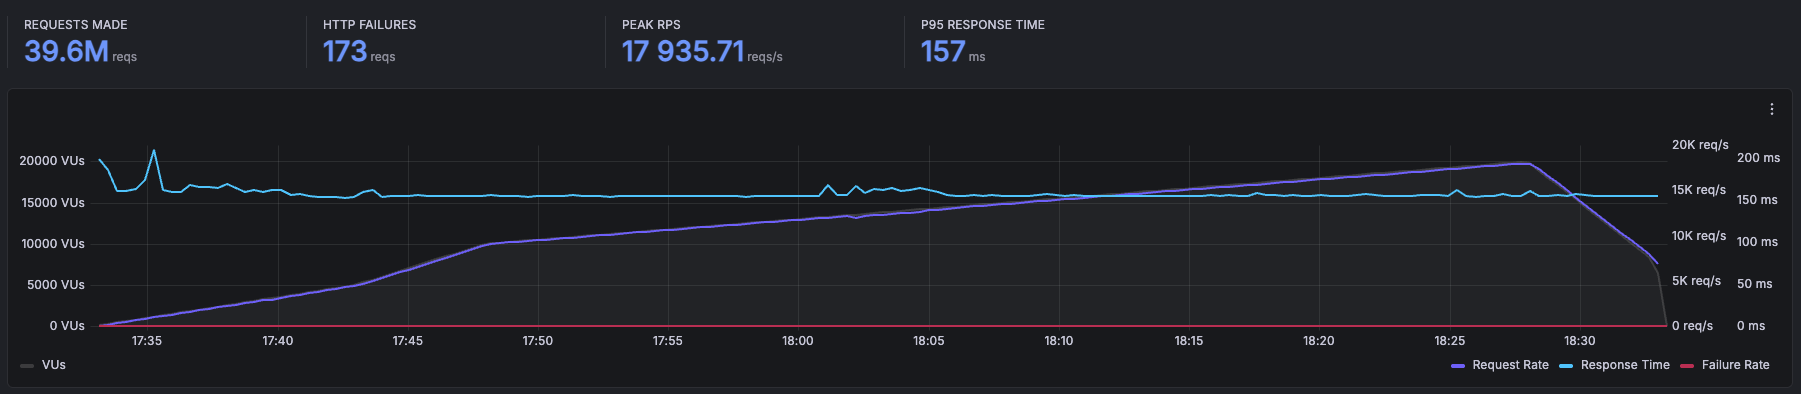
Laravel Cloud handled 39.6 million requests over the course of the test, with just 173 HTTP failures out of 39.6 million. Peak requests per second hit 17,935, P95 response time sat at 157 ms, and that line barely moved the entire run.
I want to be specific about what that means, because “17,000 RPS” is easy to say and hard to appreciate. That’s roughly a million requests per minute, hammering a single Laravel application, through the full middleware stack, with 15% of those requests deliberately holding connections open for 33 seconds each.
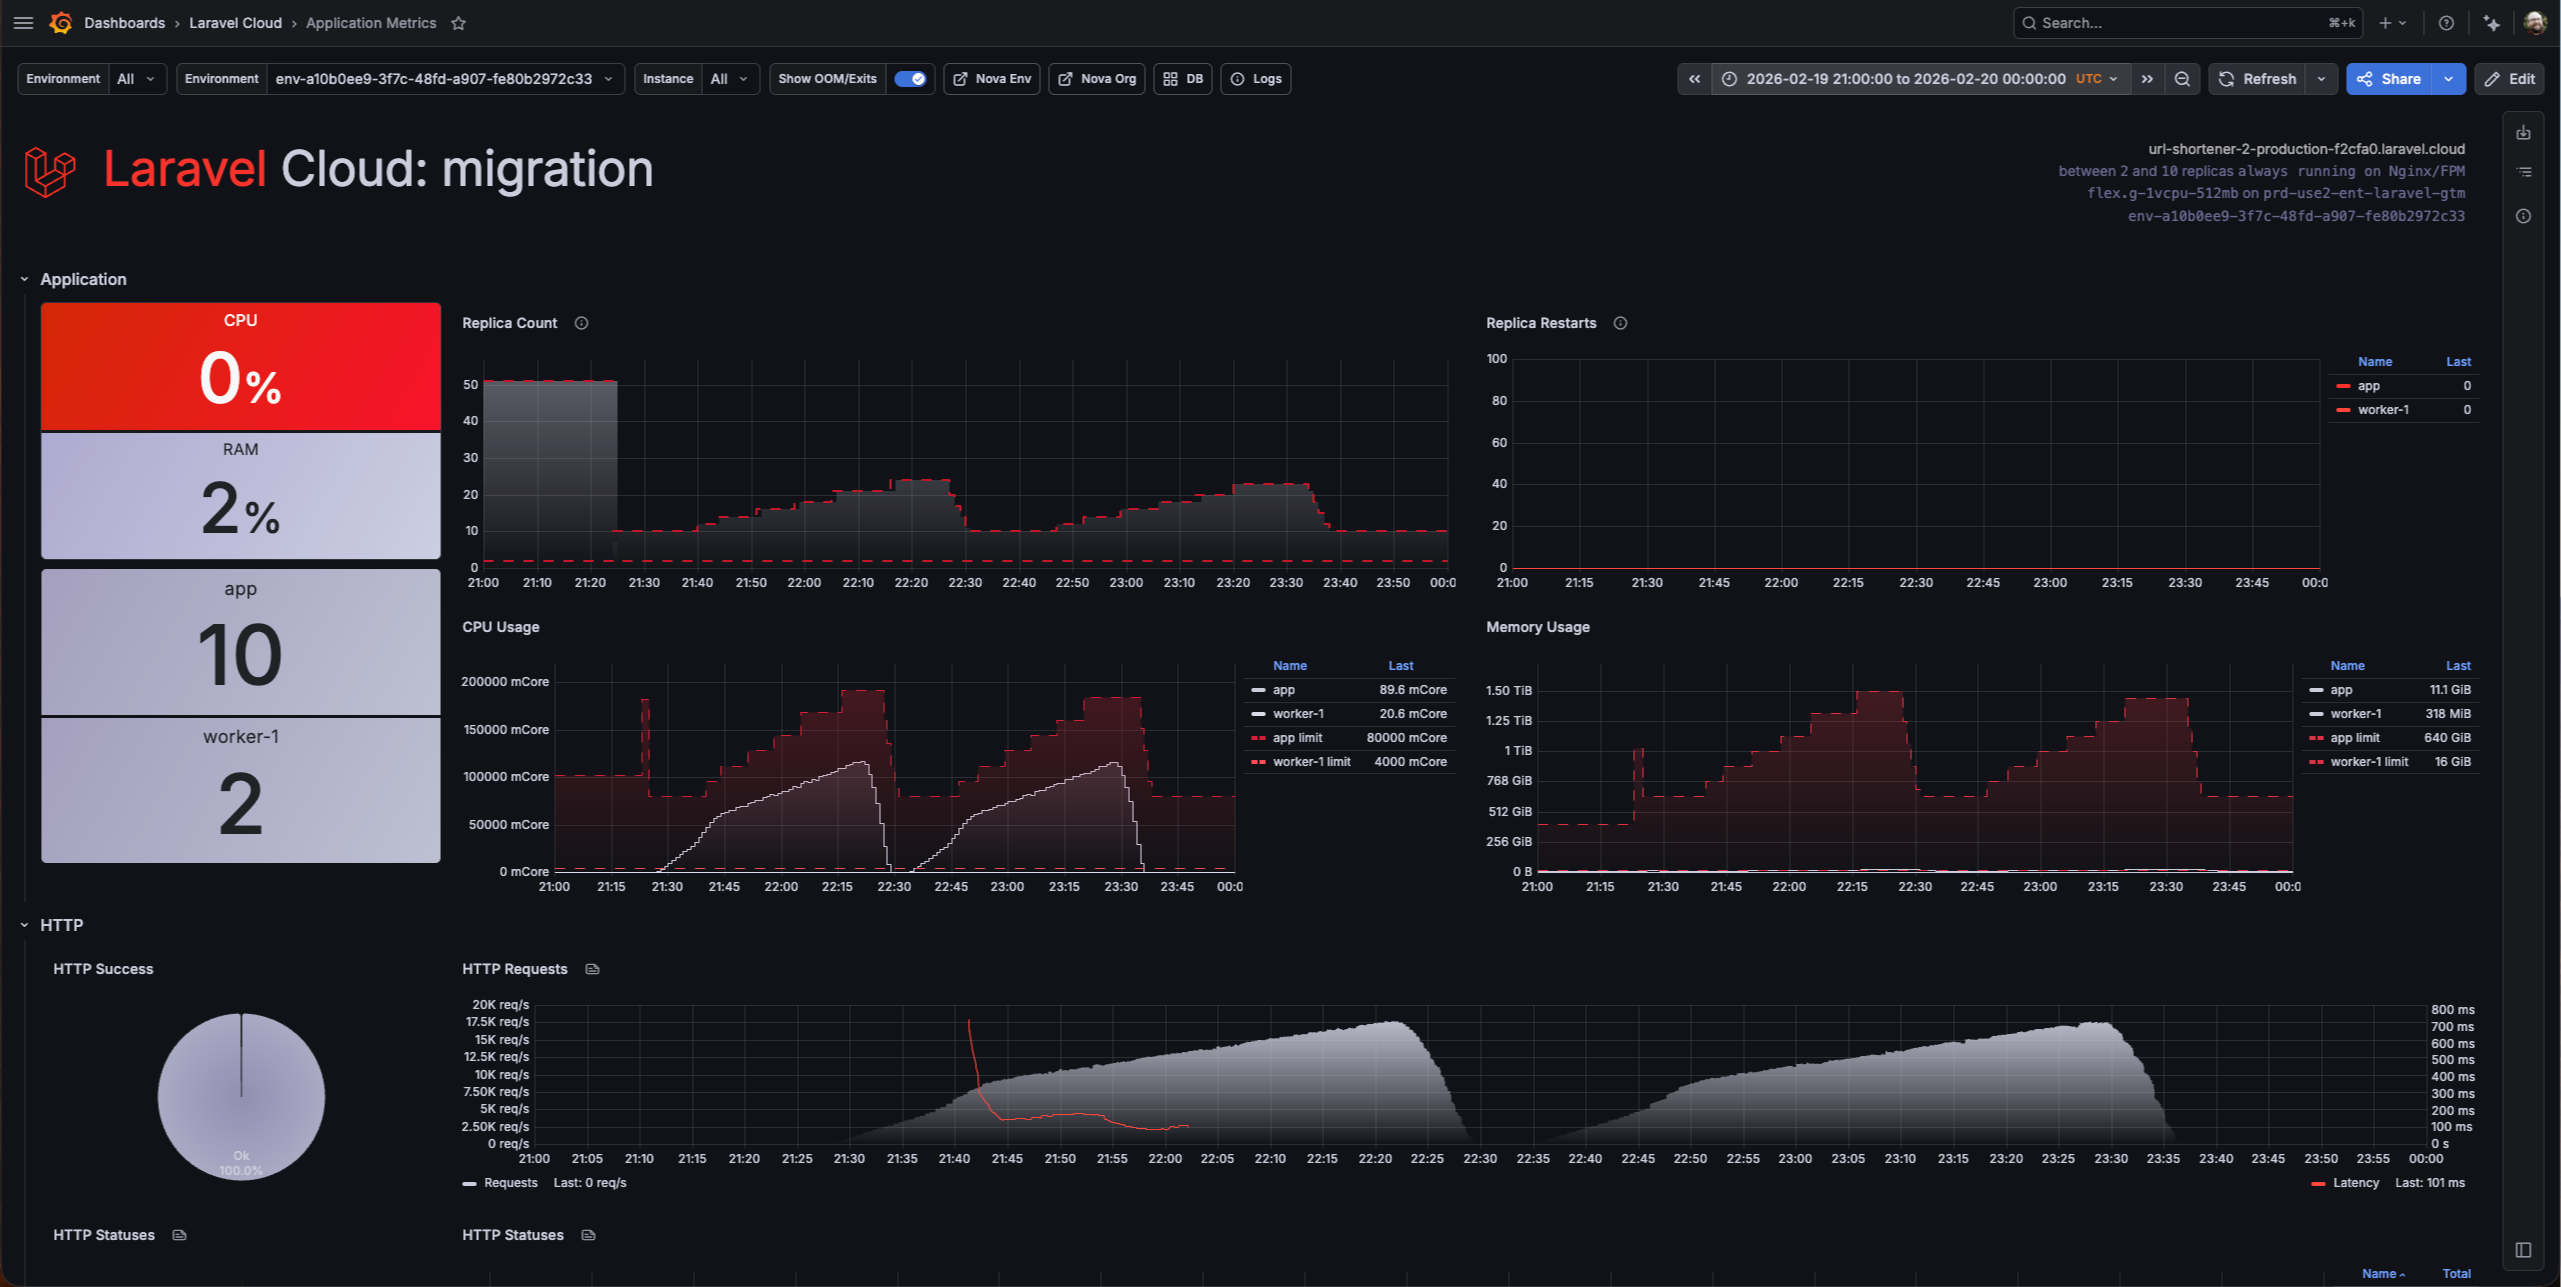
The autoscaling behavior was wild to watch in real time. The replica count spiked to around 50 during the initial ramp as Cloud scrambled to absorb the sudden load, then settled into the 10-20 range once the platform found its rhythm.
CPU usage stayed below 150,000 mCore across all replicas, memory usage stayed low (the large numbers on the dashboard are the aggregate limits across all the replicas, not actual consumption), and the HTTP Success donut stayed at 100% the entire time.
And zero replica restarts. Fifty replicas spinning up under heavy load and not a single one crashed. The platform was doing exactly what it’s supposed to do: absorbing the load by scaling horizontally without me touching anything.
There were no errors, no degradation, and no manual intervention. Just the app eating requests for an hour straight.
The Question You’re Already Asking
Yeah, I know.
“But there’s no database.”
You’re right. The jitter endpoint doesn’t hit a database; it’s simulating latency patterns, not running queries. And if I published this post without acknowledging that, you’d be right to call it out.
Here’s why I did it this way: I wanted to isolate the platform first. If I threw a database into the mix from the start and saw degraded performance, I wouldn’t know if the bottleneck was Cloud’s compute layer, the network, the database, or the interaction between all three.
Testing the platform layer in isolation tells you something specific and useful: Laravel Cloud’s compute and autoscaling model are not going to be your bottleneck. The infrastructure underneath your app can handle serious load. But I wasn’t going to stop there.
Test Two: Adding a Database
For the second round, I built something closer to a real application: a simulated chat system. GETs paginate through messages using keyset pagination. POSTs insert random messages with generated usernames.
Reads and writes. Paginated queries and inserts. Not a toy endpoint.
The database was PlanetScale Metal Postgres, connected to the Laravel Cloud private network via PrivateLink with PgBouncer available for connection pooling. Why PlanetScale and not Cloud’s integrated databases? Because this whole test started from a customer’s setup. They were running PlanetScale Metal Postgres, so I matched their stack. I did not tune the Postgres instance for this workload: no connection pool optimization, no PgBouncer adjustments, completely out of the box.
This is where things got ugly.
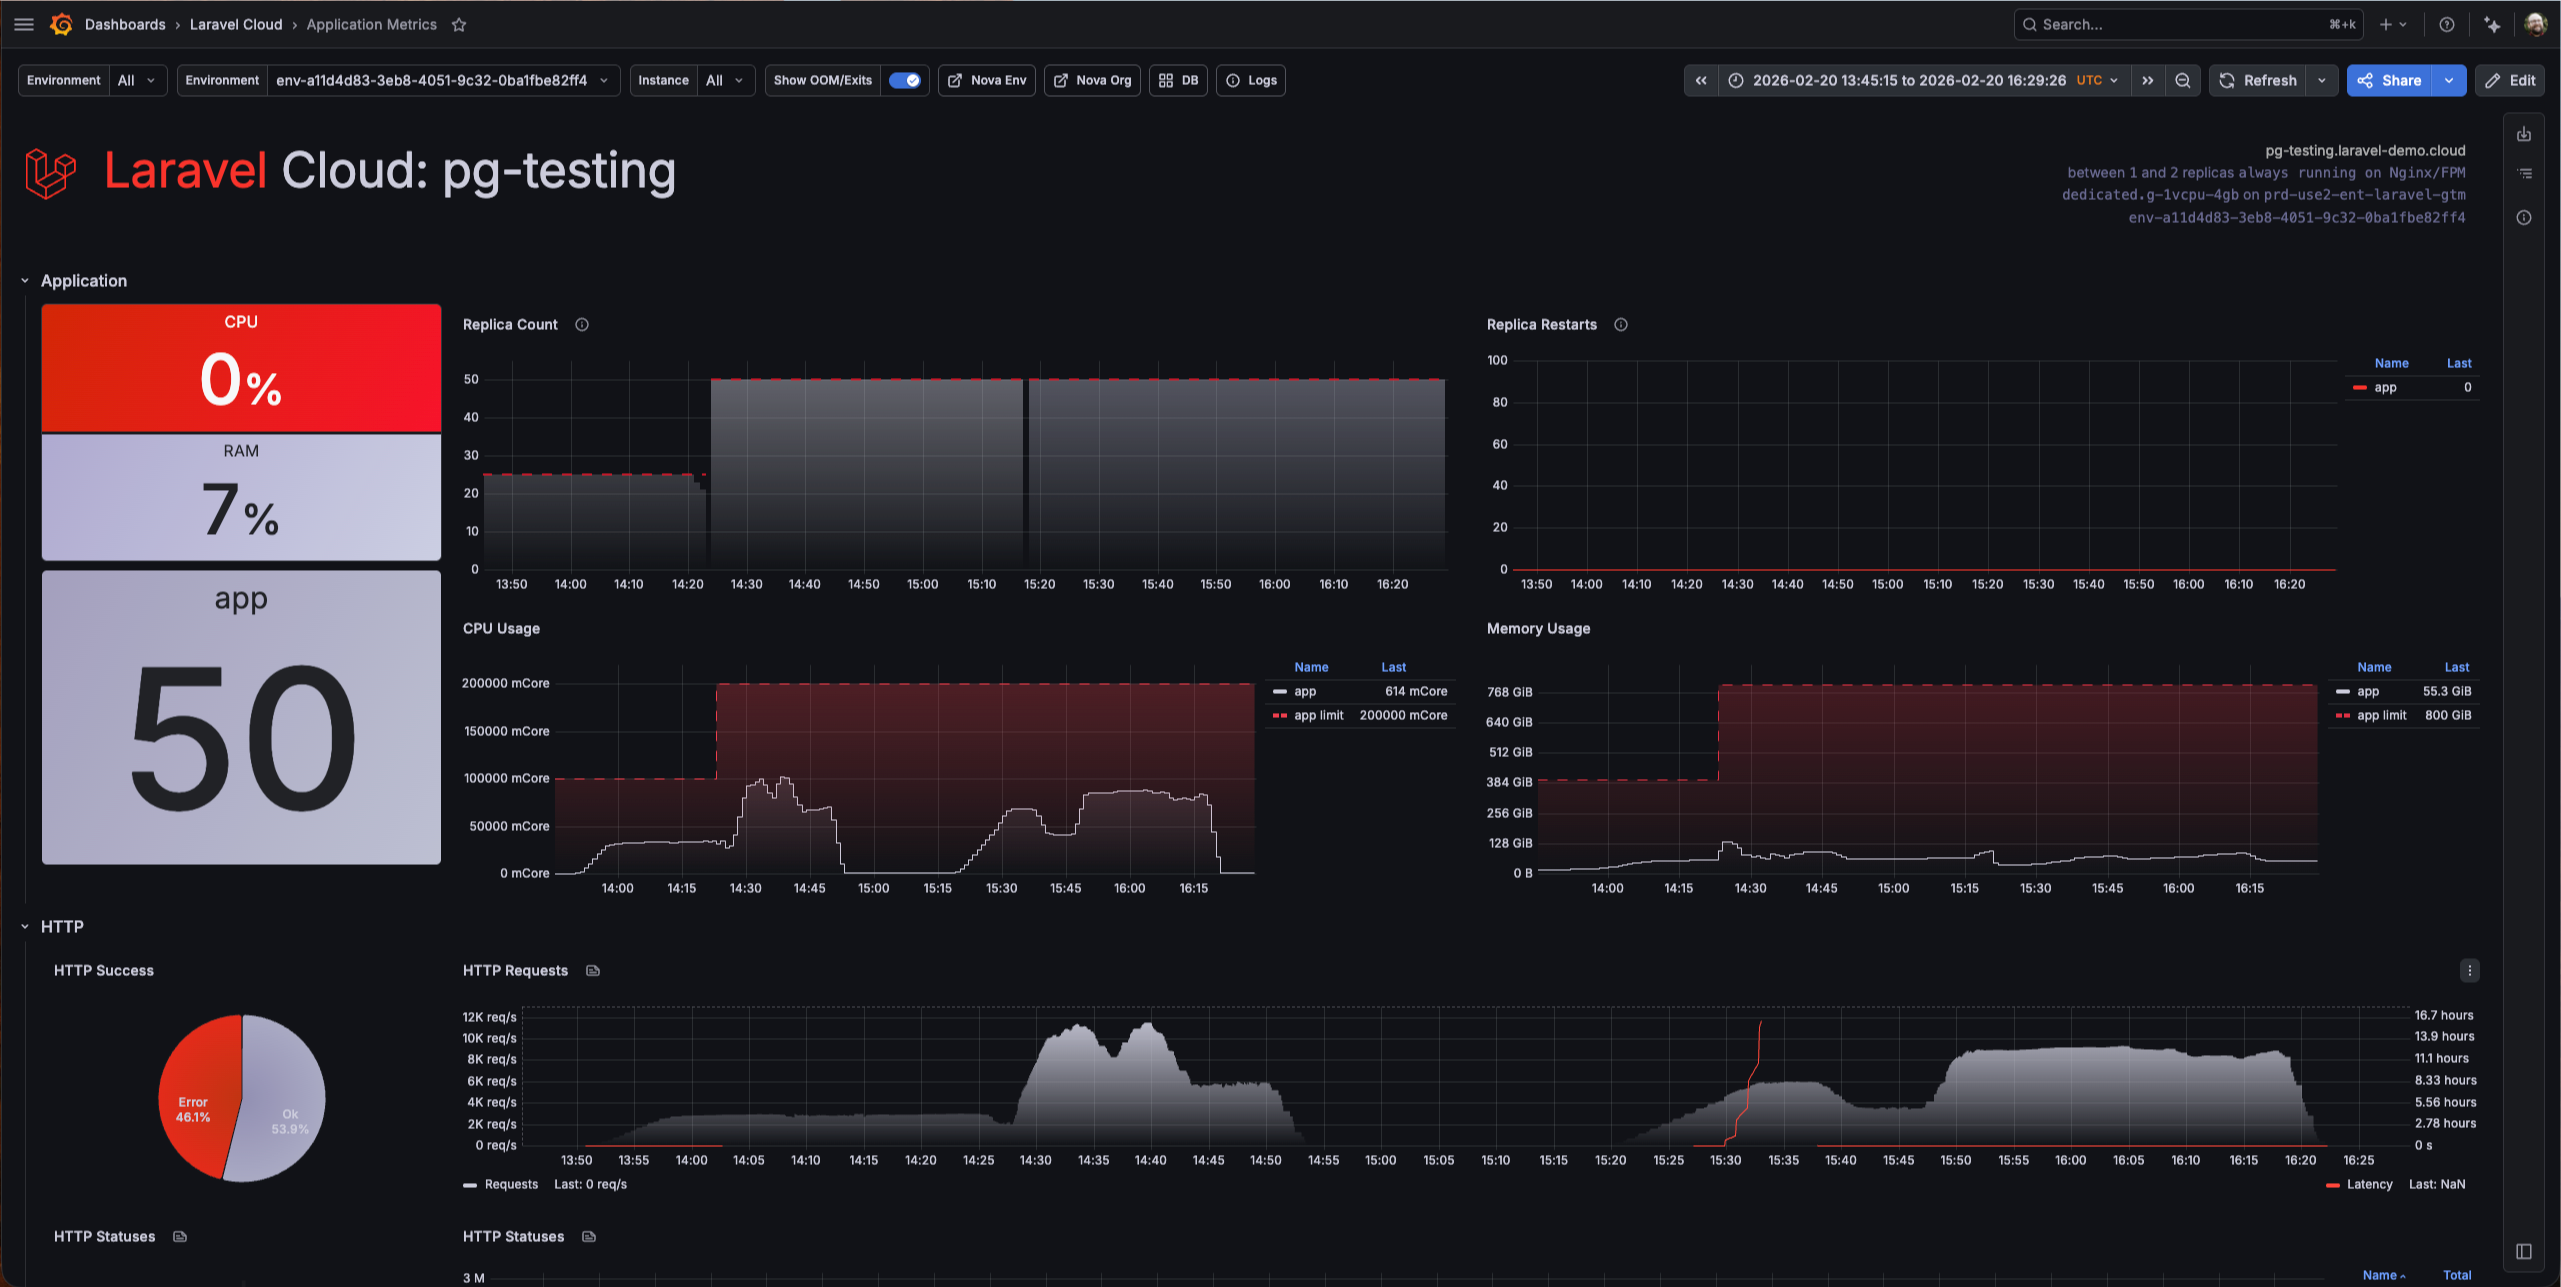
The test peaked at around 4,000 RPS. But that number doesn’t tell the real story—look at that dashboard.
There was a 46% error rate, with nearly half of all requests failed. Every single error was a database timeout or connection failure. Latency spiked to hours. Not seconds, hours. The requests weren’t failing fast. They were hanging, waiting for a database that couldn’t keep up, and eventually timing out.
Now look at what Cloud was doing while this happened: 50 replicas running, CPU usage climbed to around 100,000 mCore across all replicas, memory hit about 128 GiB, and zero replica restarts. Cloud scaled to 50 instances and held them stable the entire time.
The platform was fighting for this app. It scaled aggressively, stayed up, and didn’t crash a single replica. The compute side did everything right, but the database was the wall.
I want to be extremely clear about something: this was not a PlanetScale problem. PlanetScale Metal Postgres is a serious database product. The issue was entirely my configuration—or lack of it. I threw a massive amount of concurrent load at an out-of-the-box setup with no tuning whatsoever. When I later took time to properly configure connection pooling and adjust PgBouncer settings, the scale opened right up. The database handled the load just fine once it was set up for it.
What This Actually Tells You
If you’re evaluating Laravel Cloud for a production workload, here’s what these two tests say:
The platform layer is not your constraint: At 17,000 RPS through full middleware with realistic latency jitter, Cloud’s compute and autoscaling handled it without breaking a sweat. If your app is slow, it’s probably not because of where it’s running.
Your database configuration is almost certainly the bottleneck: Cloud scaled to 50 replicas and threw 175,000 mCore of CPU at the database test. It was ready to serve more. The unconfigured Postgres instance was the ceiling: 46% errors, latency in the hours. Once I tuned it, the database kept up. That’s not a Cloud problem or a database vendor problem. That’s a “you need to tune your database” problem, and it’s the same problem you’d have on any platform with any provider.
Autoscaling works: I didn’t pre-provision anything. I didn’t set capacity thresholds. I turned on autoscaling, pointed 20,000 virtual users at it, and Cloud figured it out. For the kind of “I don’t want to manage infrastructure” developer Cloud is built for, that’s the whole point.
The honest takeaway: if you’re planning to run a serious load on Laravel Cloud, invest your tuning time in your database layer. The app server-side is handled. The database side is where your performance budget gets spent. For tips on scaling your infrastructure on Cloud, read this.
What I’d Do Next
I’m not done with this. There are a couple of things I want to test in a follow-up:
The obvious one is to run the database test again with more aggressive tuning: pushing the connection pool sizes higher, testing different PgBouncer modes, and maybe throwing even more virtual users at it now that the database isn’t choking. I want to see where the actual ceiling is when everything is properly configured.
And yeah, I should probably build something even more realistic. Queue jobs, cache hits, the full stack of a real production app under load. The chat endpoint is closer to reality than the jitter test, but there’s still room to push it.
The Disclaimer You’re Expecting
I work at Laravel. You know that, so I’m not going to pretend this is a disinterested third-party benchmark.
But I also didn’t cherry-pick results. The 46% error rate on the database test is right there in the post, screenshot, and all. I’m telling you what I found, including the parts that aren’t a clean marketing story.
If you want to run your own tests—and you should—Grafana Cloud k6 is a solid setup. Build an endpoint that simulates your actual workload, not a health check. And tune your database before you blame your platform.
The numbers are the numbers. Do what you want with them. And if they piqued your interest, you can try Laravel Cloud for free.
FAQs
What is k6 and how does it work?
k6 is an open-source load testing tool built for developers. You write test scripts in JavaScript that define how many virtual users to simulate, how traffic should ramp up and down, and what endpoints to hit. k6 runs those scripts locally or in the cloud via Grafana Cloud k6, records response times, error rates, and throughput, and outputs the results in real time.
How does Laravel Cloud autoscaling handle traffic spikes?
Laravel Cloud autoscaling monitors incoming request load and automatically adds or removes compute replicas to match demand. When traffic rises sharply, Cloud scales out horizontally, spinning up new replicas within seconds, and scales back down once the load drops. You set the minimum and maximum replica bounds; Cloud handles everything in between.
What is bimodal latency jitter in load testing?
Bimodal latency jitter simulates two distinct response-time patterns in the same load test: a fast path that most requests follow, and a slow path that a smaller percentage hit. In this test, 85% of requests responded in 2 to 120 milliseconds, while 15% were delayed by around 33 seconds. This mirrors real-world traffic more accurately than a flat-latency test, because it stresses connection pooling and autoscaling with slow requests holding connections open while fast ones continue to pile in.
How many requests per second can Laravel handle?
With Laravel Cloud autoscaling enabled and no database on the critical path, this test sustained 17,000 requests per second through the full Laravel middleware stack, including session handling, cross-site request forgery protection, and cookie encryption.
With a database connected and no connection pool tuning, throughput dropped to around 4,000 RPS with significant error rates. Once the database is properly configured for connection pooling, the compute layer is no longer the bottleneck. Laravel Cloud scaled to 50 replicas and held them stable throughout both tests.
PyleSoft’s platform, for example, is handling 1.5 million requests per day across 13 sites.