
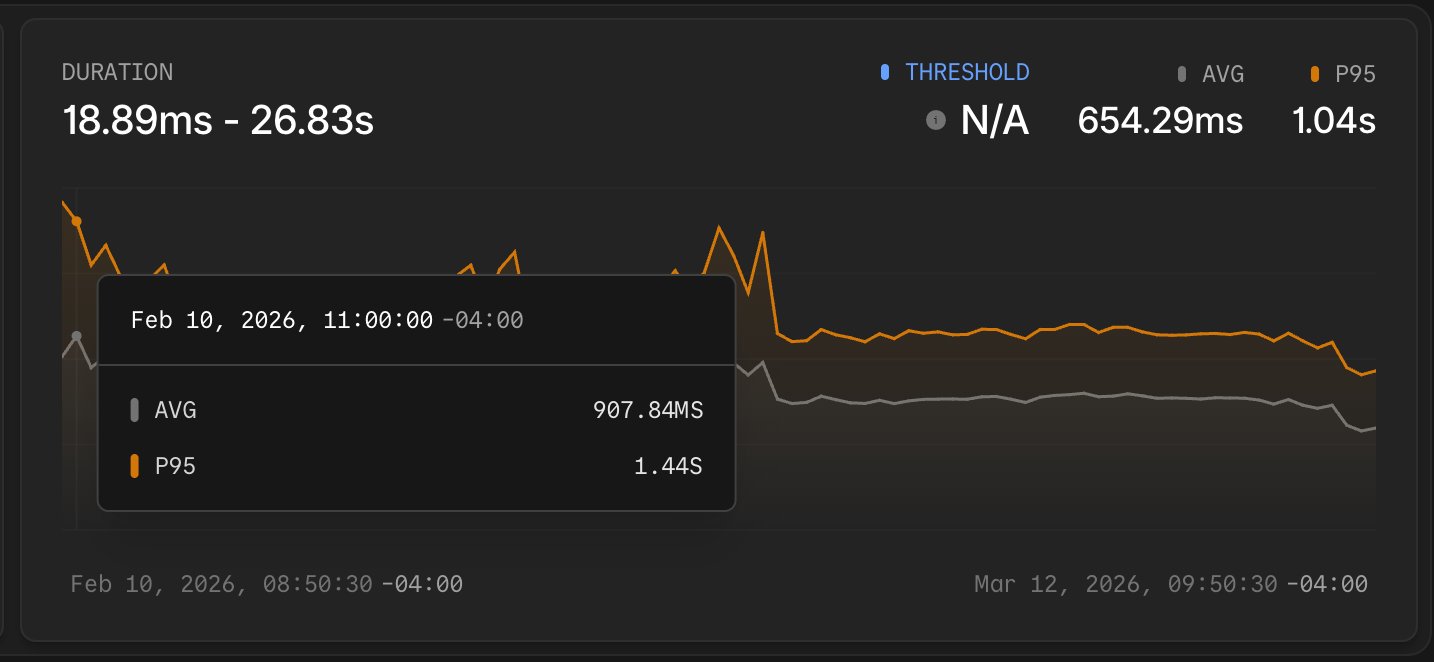
The environment dashboard on Laravel Cloud was getting slower. Months of active development had pushed the average response time on one of the most-visited routes to 907 milliseconds, with a P95 of 1.44 seconds.
 Some extreme requests fired more than 150 database queries and returned payloads larger than 1.7 MB. Before writing a single fix, we needed to see exactly what was happening inside each request in production. Laravel Nightwatch gave us that visibility.
This post walks through how we used Nightwatch to find the bottlenecks, the specific changes we made, and how we were able to reduce response times by about 60% incrementally over the course of a month.
| Metric | Before | After | Reduction |
|---|---|---|---|
| Avg response time | 907 ms | 354 ms | ~61% |
| P95 response time | 1.44 s | 624 ms | ~57% |
| Peak payload size | 1.7 MB | ~300 KB | ~82% |
| Queries per request | ~100 (up to 150+) | ~50 | ~38% |
Why the Laravel Cloud Dashboard Was Getting Slower
Laravel Cloud moves fast. That pace makes it easy for performance to slip incrementally, one feature at a time.
The environment dashboard is one of the most-visited pages in the application. Users land there constantly to check deployment status, inspect resources, and manage their infrastructure. A slow response on this route touches almost every active user in almost every session.
A month ago, the numbers were hard to ignore: an average response time of 907 ms, a P95 of 1.44 s, and payloads reaching 1.7 MB on the worst requests. On average, each page load ran about 100 database queries; in extreme cases, that climbed above 150.
The problem was cumulative: many small additions over time led to a page that had quietly become twice as slow as it needed to be—a new relationship included here, an extra property returned there, nested relationships that had already been loaded somewhere else.
Finding the Problem with Laravel Nightwatch
Laravel Nightwatch gave us visibility into each request. It traces HTTP requests and links each one to the database queries, jobs, and exceptions that ran during the request. Opening a slow request shows a complete list of every query: the SQL, the duration, and the line of code where the query was called.
As we started digging into the requests in Nightwatch, a few issues appeared immediately:
- A couple of n+1 queries had crept into the dashboard route. A single page load was triggering repetitive queries for relationships that could have been loaded in one pass.
- We were fetching data the frontend never rendered: chaperoned relationships that were inefficient and extra columns on every returned model.
- We were loading all of the organization’s resources (databases, caches, buckets, and WebSocket clusters) within the initial request.
- The baseline query duration was around ~6ms most of the time, which seemed high.
Why Production Visibility Matters More than Local Debugging
Seeing 150-plus queries listed on a single request made the scope of the problem clear. Several groups were near-identical—the signature of an n+1 loop.
On smaller organizations and in local development, these loops ran only a handful of times and stayed under the radar. On larger organizations with dozens of resources, the same loops added significant latency to every request. We rarely test with large accounts locally, so the issue reached production undetected.
Nightwatch closed that gap. Each request trace showed exactly which queries ran, in what order, and how long each took under real user load. Without that visibility, we would have been guessing at the source of slowness and verifying locally, where query patterns and payload sizes don’t always reflect production traffic.
Fixing N+1 Queries and Redundant Data
We started with n+1 queries, since Nightwatch made the highest-frequency patterns easy to spot.
N+1 queries: A few Eloquent relationships were loading lazily inside loops. We reworked these relationships so that we could eager-load them instead of repeating the query for every resource in the organization.
Redundant data: Several of our models use chaperone() on their relationships, which automatically sets the inverse relationship. When those models were serialized with toArray(), the chaperoned inverse relationships were included in the output, duplicating data that was already present higher up in the payload. A parent model would include its children, and each child would include the parent again, inflating the response far beyond what the frontend needed.
We converted the worst offenders to use Laravel API Resources, which gave us explicit control over which attributes and relationships each endpoint returns. Instead of serializing entire models, we defined exactly the fields the frontend consumed and used whenLoaded() to conditionally include relationships only when they had been eager-loaded for that specific request.
Deferred loading: Some data was fetched on every page load, even though it’s only needed once a user goes to perform specific actions. We deferred loading organization-wide resources until after the initial page load. These included databases, caches, filesystems, and WebSocket clusters. This change alone deferred over 20 queries to a subsequent request, and typically, the subsequent request finished loading before users ever loaded the modals that display the data.
As part of this, we also refactored how we reload data to make it much more efficient. Previously, when a database was updated, we reloaded all the data on the page: the environment details, domains, databases, caches, buckets, etc. Now, we’re able to perform much more targeted reloads. When a database is updated, we only reload the list of databases.
Using Claude and Laravel Boost to Trace Frontend Usage
The biggest time cost in this work was not writing the fixes. It was understanding what data each frontend component actually needed before we removed anything.
The environment dashboard has a complex canvas with many interconnected components. Before trimming a resource or removing a relationship from a response, we needed confidence that nothing would break. We used Claude Code with Laravel Boost to trace usage across the frontend codebase to determine which properties we could safely remove.
Boost equips AI agents with Laravel-specific tools through an MCP server, giving them access to version-specific documentation and project context.
In practice, Claude could follow a data property from an Eloquent model through the controller to the frontend component that displayed it, confirming which properties were safe to remove. That traceability made the refactor much safer: instead of manually auditing dozens of components, we could confirm unused properties quickly and focus on the actual fixes.
Claude also handled a significant portion of the mechanical refactor work. Once we determined the plan to address the next priority, we sent Claude off to refactor so we could focus on finding the next bottleneck.
Using Emulated Prepares
While looking at query durations in Nightwatch, we noticed that even simple queries had a baseline duration of around 6 ms. That floor seemed high for straightforward lookups and was consistent across the route.
We recently introduced RDS Proxy, and after running extensive benchmarks against the proxy, our reader, and our writer connections, we found the extra latency was coming from the proxy, but overall latency to the proxy (e.g., TCP connection) wasn’t significant.
Upon further inspection, we realized the cause was that we were using native prepared statements. With native prepared statements enabled, PHP Data Objects sends prepared statements to MySQL as two separate round-trips: one to prepare the statement and one to execute it.
This introduced two problems: extra latency and the inability to use the proxy’s multiplexing capabilities. With native prepared statements, the proxy will pin connections 1:1, meaning it will spin up a lot of backend connections to the database cluster, which is the opposite of what we want with a proxy.
The solution isn’t as simple as bypassing the proxy to save on latency: in production workloads, the benefits of going through a proxy might outweigh skipping the extra network hop and talking to the cluster directly.
Enabling emulated prepares tells PDO to handle parameter binding on the PHP side and send the final query in a single round trip. This also allows for the proxy to hold fewer backend connections to the cluster, while holding several frontend connections from our app. We enabled this in our database configuration:
This single change dropped the baseline query duration from ~6 ms to ~3.5 ms. Across 50+ queries per request, that saved roughly 125 ms. Emulated prepares are safe for the vast majority of Laravel applications: PDO still escapes all bound parameters client-side, and Eloquent handles type casting at the application level.
The Results After a Month of Fixes
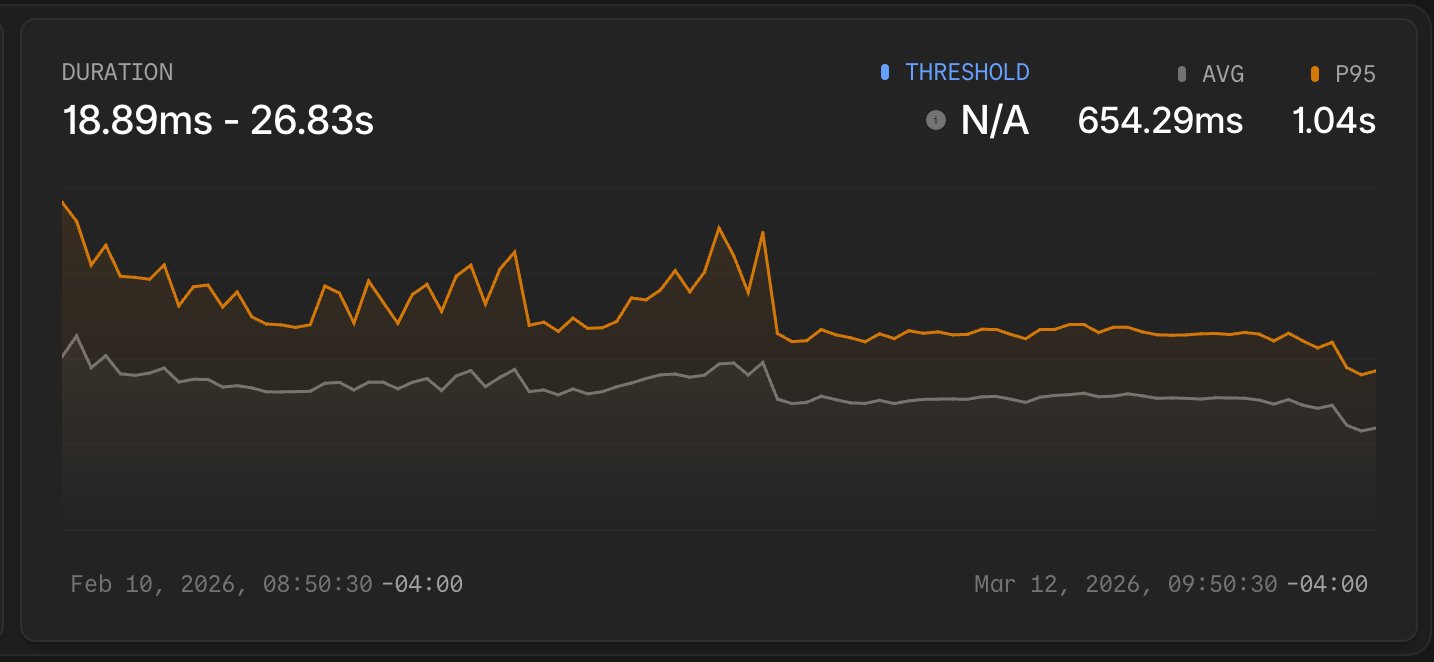
Over the course of a month, the Nightwatch charts show clear dips where each improvement landed.
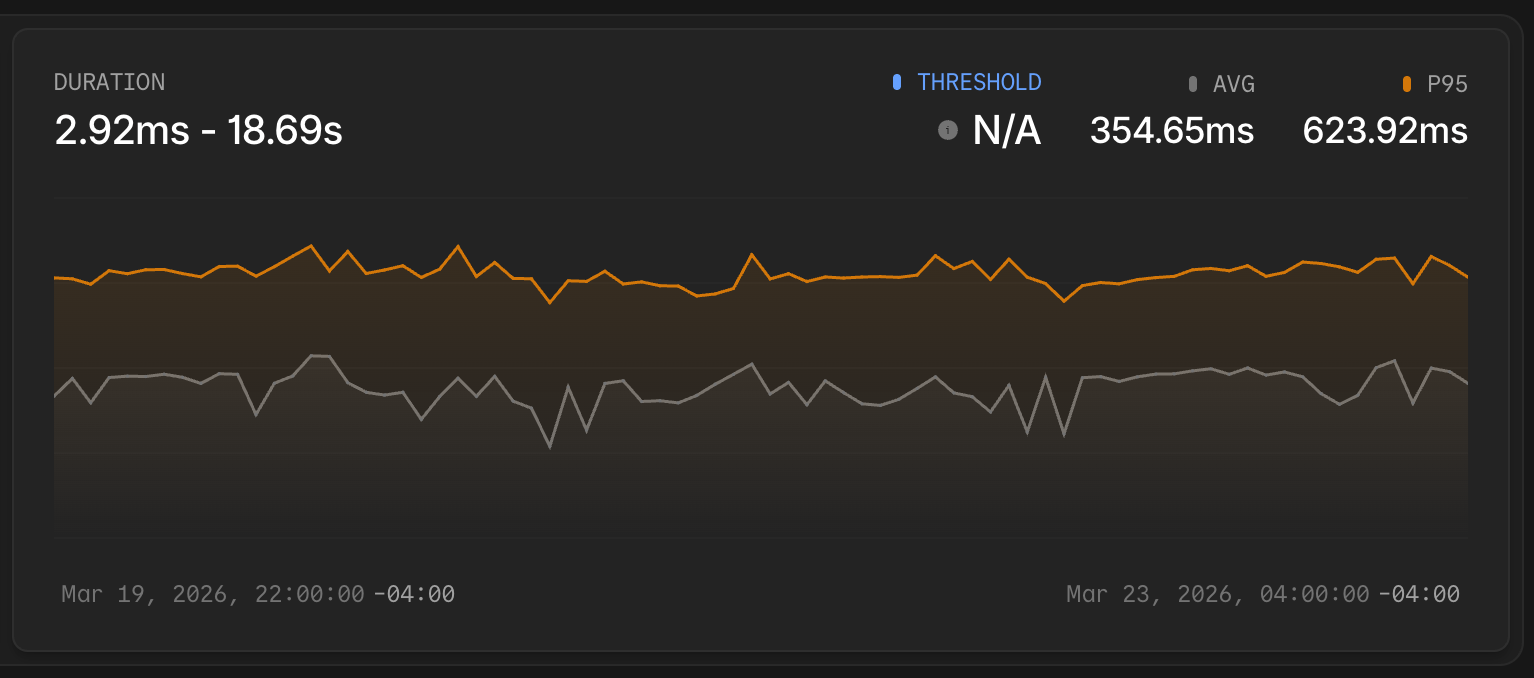
Average response time dropped from 907 ms to 354 ms. The P95 came down from 1.44 s to 624 ms. Peak payload size fell from 1.7 MB to approximately 300 KB.
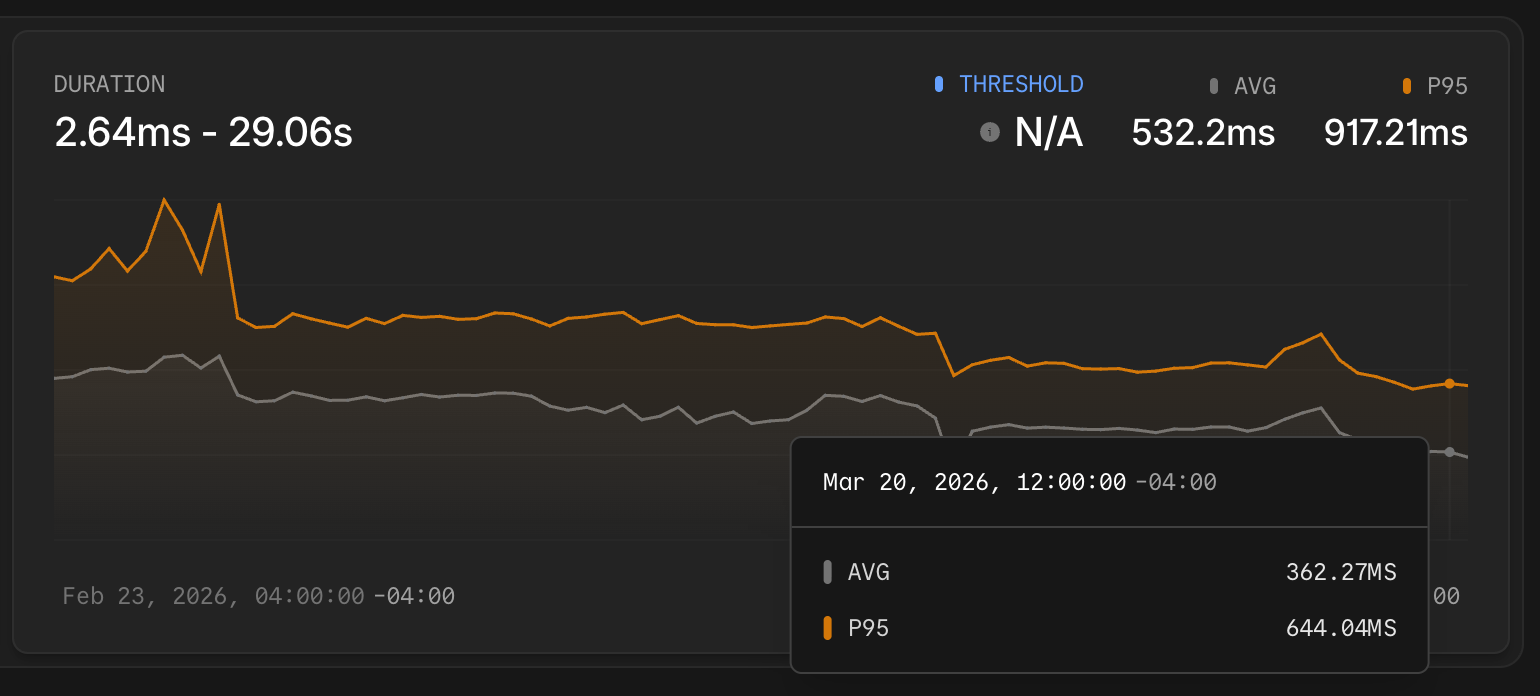
 Looking at the duration chart over the month, the inflection points are visible. The average response time and P95 both dropped sharply a few times as improvements landed, then stabilized at the new lower baseline. That kind of before/after signal would have been hard to reconstruct from logs alone.
A Repeatable Process for Laravel Query Optimization
Performance work on a live application requires two things: a reliable baseline to measure from, and a way to confirm that each change moved the numbers. Laravel Nightwatch provided both throughout this investigation, from the first slow request we opened to the final chart showing the P95 line settling at 624 ms.
The environment dashboard will continue to evolve, and response times will require attention as new features ship. Through this work, we can see a repeatable process: when a route gets slow, open individual requests in Nightwatch, identify the specific queries or payload issues, fix them one at a time, and watch the averages respond.
To apply this process to your own application, start with the Laravel Nightwatch documentation and connect your app. The requests overview is where every investigation in this post began. If you’re using Laravel Cloud, every environment has built-in Nightwatch support for monitoring